>> I = imread('Shape.png');
>> g = rgb2gray(I);
>> bw = im2bw(g);
>> L = bwlabel(bw);
>> s = regionprops(L, 'Centroid');
>> c = cat(1, s.Centroid);
>> figure, imshow(bw);
>> hold on
>> plot(c(:,1), c(:,2), 'b*');
>> hold off
Image processing using Matlab
วันเสาร์ที่ 6 มิถุนายน พ.ศ. 2558
Finding Centroids
วันอาทิตย์ที่ 31 พฤษภาคม พ.ศ. 2558
Counting
>> clear
>> close all
>> clc

>> I = imread('C:\Temp\Universe.bmp');
>> g = rgb2gray(I);
>> bw = im2bw(g);
>> figure, imshow(bw);
>> bw2 = im2bw(g, 0.3);
>> bw1 = im2bw(g);
>> bw1 = ~bw1;
>> bw2 = ~bw2;
>> b1 = bwboundaries(bw1);
>> figure, imshow(bw1);
>> text(10,10,strcat('\color{green}Objects Found : ',num2str(length(b1))));
>> hold on
>> for k = 1:length(b1) ...
          boundary1 = b1{k}; ...
          plot(boundary1(:,2), boundary1(:,1), 'g', 'LineWidth', 0.2); ...
     end
Universe
Binary (bw1)
Binary Boundary (bw1) found 808 objects
>> b2 = bwboundaries(bw2);
>> figure, imshow(bw2);
>> text(10,10,strcat('\color{red}Objects Found : ',num2str(length(b2))));
>> hold on
>> for k = 1:length(b2) ...
          boundary2 = b2{k}; ...
          plot(boundary2(:,2), boundary2(:,1), 'r', 'LineWidth', 0.2); ...
     end
Binary (bw2)
Binary Boundary (bw2) found 1691 objects
วันเสาร์ที่ 30 พฤษภาคม พ.ศ. 2558
Corner Detection
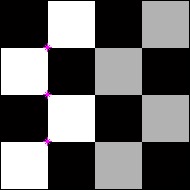
>> % Create a checkerboard image.
>> I = checkerboard(40,2,2);

>> % Find the corners in the image.
>> C = corner(I);

>> % Display the corners when the maximum number of desired corners is the default setting of 200.
>> subplot(1,2,1);
>> imshow(I);
>> hold on
>> plot(C(:,1), C(:,2), '*', 'Color', 'c')
>> title('Maximum Corners = 200')
>> hold off
Maximum Corners = 200
>> % Display the corners when the maximum number of desired corners is 3.
>> corners_max_specified = corner(I,3);
>> subplot(1,2,2);
>> imshow(I);
>> hold on
>> plot(corners_max_specified(:,1), corners_max_specified(:,2), ...
     '*','Color','m')
>> title('Maximum Corner = 3')
>> hold off
>> clear
>> close all
>> clc

>> % Second Example
>> I = imread('Heart.bmp');
>> figure, imshow(I);
>> I = imdilate(I,strel('disk',2));
>> g = rgb2gray(I);
>> bw = im2bw(g);
>> bw = ~bw;
>> figure, imshow(bw);
>> C = corner(bw);
>> hold on
>> plot(C(:,1), C(:,2), 'r*');
Original
>> clear
>> close all
>> clc

>> % Third Example
>>I = imread('Football.bmp');
>> figure, imshow(I);
>> g = rgb2gray(I);
>> figure, imshow(g);
>> C = corner(g);
>> hold on
>> plot(C(:,1), C(:,2), 'go');

>> bw = im2bw(g);
>> figure, imshow(bw);
>> D = corner(bw);
>> hold on
>> plot(D(:,1), D(:,2), 'yo');
Original
Points of Corner in Grayscale
Points of Corner in Binary
วันพฤหัสบดีที่ 14 พฤษภาคม พ.ศ. 2558
Background Subtraction
%Read Background Image
Background = imread('background.bmp');
%Read Current Frame
CurrentFrame = imread('original.bmp');
%Display Background and Foreground
subplot(2,2,1); imshow(Background); title('BackGround');
subplot(2,2,2); imshow(CurrentFrame); title('Current Frame');
%Convert RGB 2 HSV Color conversion
[Background_hsv] = round(rgb2hsv(Background));
[CurrentFrame_hsv] = round(rgb2hsv(CurrentFrame));
Out = bitxor(Background_hsv, CurrentFrame_hsv);
%Convert RGB 2 GRAY
Out = rgb2gray(Out);
%Read Rows and Columns of the Image
[rows columns] = size(Out);
%Convert to Binary Image
for i = 1:rows
for j = 1:columns
if Out(i, j) > 0
BinaryImage(i,j) = 1;
else
BinaryImage(i,j) = 0;
end
end
end
%Apply Median filter to remove Noise
FilteredImage = medfilt2(BinaryImage,[5 5]);
%Boundary Label the Filtered Image
[L num] = bwlabel(FilteredImage);
STATS = regionprops(L, 'all');
cc = [];
removed = 0;
%Remove the noisy regions
for i=1:num
dd=STATS(i).Area;
if (dd < 500)
L(L==i)=0;
removed = removed + 1;
num=num-1;
else
end
end
[L2 num2] = bwlabel(L);
% Trace region boundaries in a binary image.
[B,L,N,A] = bwboundaries(L2);
%Display results
subplot(2,2,3), imshow(L2); title('BackGround Detected');
subplot(2,2,4), imshow(L2); title('Blob Detected');
hold on;
for k=1:length(B),
if(~sum(A(k,:)))
boundary = B{k};
plot(boundary(:,2), boundary(:,1), 'r','LineWidth',2);
for l=find(A(:,k))'
boundary = B{l};
plot(boundary(:,2), boundary(:,1), 'g','LineWidth',2);
end
end
end
---------------------------------------------------------------------
Refer to https://www.pantechsolutions.net/blog/matlab-code-for-background-subtraction/
วันจันทร์ที่ 11 พฤษภาคม พ.ศ. 2558
Various to plot an image histogram
>>  f = imread('flowers.jpg');

>> g = rgb2gray(f);

>> h = imhist(g);
>> h1 = h(1:10:256);
>> horz = 1:10:256;
>> bar(horz, h1)
>> axis([0 255 0 9000])
>> set(gca, 'xtick', 0:25:255)
>> set(gca, 'ytick', 0:1000:9000)
>> stem(horz, h1, 'fill')
>> plot(h)
วันพฤหัสบดีที่ 9 เมษายน พ.ศ. 2558
Basic of Image processing using Matlab
>> I = imread('flamingo.jpg');
>> size(I)

ans =

   228   221     3

>> whos I
  Name        Size                Bytes  Class    Attributes

  I         228x221x3            151164  uint8
>> imfinfo flamingo.jpg

ans =

             Filename: 'flamingo.jpg'
        FileModDate: '10-Apr-2015 02:38:18'
               FileSize: 7248
               Format: 'jpg'
    FormatVersion: ''
                 Width: 221
               Height: 228
            BitDepth: 24
          ColorType: 'truecolor'
FormatSignature: ''
NumberOfSamples: 3
    CodingMethod: 'Huffman'
   CodingProcess: 'Sequential'
          Comment: {}
>> imshow(I)
วันศุกร์ที่ 27 มีนาคม พ.ศ. 2558
Histogram of Grayscale image
>> I = imread('Image0001.bmp');
>> G = rgb2gray(I);

>> figure, imshow(G);
>> figure, imhist(G);
>> figure, imhist(G, 10);
สมัครสมาชิก:
ความคิดเห็น (Atom)


